Power BI is a fantastic, and relatively easy, way of getting some great reports and analytics out of your Spiceworks database.
UPDATE: I have added this video tutorial to hopefully make this clearer and easier to follow.
Contents [hide]
Creating your queries
First you will need to know how to extract the data you are looking for. The easiest way to do this is to use something like http://sqlitebrowser.org/ to browse the database. This will show the database schema and allow you to build and test your queries. NOTE: remember to run this on a copy of your database.
Create the ODBC Connection to the Spiceworks database
You need to create an ODBC connector for your spiceworks database to input the data to Power BI.
Note: Its best to use a copy of your database instead of trying to connect to your production database
- Go to http://www.ch-werner.de/sqliteodbc/ and download the correct version for system
- Install using default options
- Go to ‘Administrative Tools -> ODBC Data Sources’
- Go to the ‘System DSN’ tab
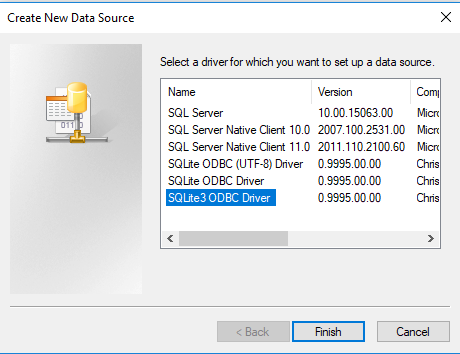
- Click on ‘Add’
- Click on ‘SQLite 3 ODBC Driver’ and click Finish

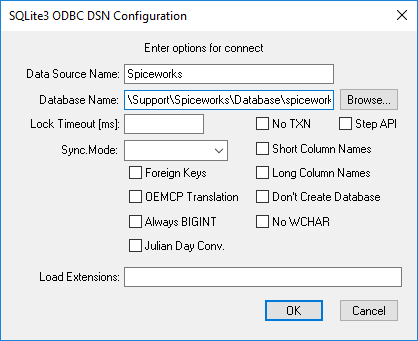
- Give the Data Source a name and browse to the location of the database

- Click OK
Connecting to the Data Source in Power BI
- In Power BI click on ‘Get Data’
- Select ODBC as the connection type

3. Select the Data Source name from the dropdown list
4. At this stage, I find it best to enter an SQL statement, anytime I have tried to pull in the whole database I ran into a lot of errors. To enter an SQL statement click on ‘Advanced Options’
6. Paste in your statement (See sample below) and click OK.
Your data is now loaded into Power BI and you can have loads of fun creating reports and visualizations
——————–
Sample query
This will get the following from open tickets: ticket number as a link, creators full name, creators AD username, Summary, category, status, priority, Assigned to, date created, days open
Note: make sure to change it to your server name in the ticket link:
————————————————————–
select
tickets.id as “Ticket #”
, (select first_name as “Created By” from users where tickets.created_by=users.id) AS “Created By”
, SUBSTR(summary,1,5) AS Summary
, category
, status
, priority
, (select first_name from users where tickets.assigned_to=users.id) AS “Assigned to”
,tickets.created_at
,tickets.closed_at
, round(julianday(tickets.closed_at) – julianday(tickets.created_at),2) AS “Days Open”
from tickets
————————————————————-


I don’t suppose you have the queries for your example dashboard above do you? I’ve been playing with your sample script and can get some info, but not close to the great one you’ve got and it’s really quite impressive.
Hi Sam,
Yeah sure, I can give you some queries if you want. What kind of info are you looking for? What are you trying to get out of the database?
Agreed. That dashboard in the screenshot is very nice and would be perfect for my organization. Could you supply the queries for those? I’ll leave my email behind.
Hey Joe,
Sorry for the reply in getting back to you. Your comment got lost in the sea of spam messages!
Are you still lookingfor help with this?
Cheers,
Sean
Hey Sean, whats up bro.
Thanks for the explanation, can you send me the query that you using to build the dashboards for image on top of this tutorial?
I really appreciate your tutorial. Thx!
Hi Nathan,
Sure, no problem. I will send you an email tomorrow when I am at work.
Cheers
Sean
Hi Nathan,
I have sent you an email.
Cheers,
Hi Sean,
I’d really appreciate it if you could share the query with me too. Thanks for the great work putting this up. Found it really useful – my first time with PowerBI.
All the best
Jon
Hi John,
No problem, glad to be of help. Ill send you an email with the query.
If you need any more help with it let me know.
Cheers,
Sean
Sean, Would you be kind enough to share the query with me? I’m seasoned with PowerBI but not the Spiceworks schema.
Hi Chad,
The sample query is at the bottom of the post above.
Sean
Hi Sean
I would appreciate if you could also share those queries with me as well.
I’ve found this guide really useful, so thank you.
Troy
Hi Troy,
No problem, Ill send you an email tomorrow.
Cheers,
Sean
Hi Sean,
I apologize for being a leach but could you send me the same queries the others we’re requesting?… First time using BI as well
Thanks
Mark
Also, do you have any queries that you could share regarding live inventory of Desktops, Laptops, Servers, OS’s etc?
Thanks
Mark
Hi Mark,
I will send you an email with the original query.
In terms of the inventory, I dont currently have anything but it would be easy to setup. If you can give me an idea of what you are looking for I can give it a go.
Cheers,
Sean
Sean, If you’re still willing to share your dashboard Query’s I’d be most appreciative. I’m working on showing my boss what PowerBI can do to hopefully get some much needed attention there.
Hi Andy,
I will send you an email with the query.
Cheers,
Sean
Sean,
As the others, if you are still willing, I’d also appreciate the query you used.
Thank you!
Hi Sean, Are you still willing to share your dashboard Query’s?
Looking at sharing this with execs.
Hi Sean,
I appreciate your insight.
I do need your help. In following the sample query it fails for me.
We are running the spiceworks ver7.5 with the last update was done.
——————-
Error:
Error Code : 17
Message : database schema has changed
near “#””: syntax error
Result : Schema
another error is :
Execution finished with errors.
Result: near “#””: syntax error
At line 1:
select
Hi Ushe,
Are you getting this error when you run the query in SQLite?
Sean
HI i have the same errors, when esecute the query.
Can u help me?
Thanks a lot.
Hi Sean,
I would gladly appreciate a copy of your queries. Thank you in advance.
Hi Charles,
The query is at the bottom of this post.
Sean
Add me to the list of folks that would appreciate a copy of the PowerBI queries.
Thanks.
Hi Michael,
The query is at the bottom of this post.
Sean
Hi Sean,
I tried to use your query and found the video very interesting.
I don’t know much about Databases and BI, but studying SpiceWorks DB, I don’t find these columns as “Ticket #” or even “Created By” I always get errors …. Although when exporting the reports directly in spiceworks, using XLS or CSV both have these columns.
Could you give me an idea of what to do?
BR, from Brazil.
Hi Bruno,
Thanks for checking out my blog.
Where it uses “as” in the query, they are variable names for columns. So you won’t see those columns in the database.
Where it says ‘tickets.id as “Ticket #’, the column name is ‘id’ in the ‘tickets’ table.
Hope that makes sense. Let me know if you have any other issues. I’ll send you an email which you can reply to if you want to send me a screenshots of your issues.
Cheers,
Sean
Hello Sean! Just another guy who would like that query for the image for the top. Do you think you could hook me up?